Now You See It
 shows graduate students Sujal Bista (far left) and Patricia Sazama brain images that could improve diagnosis of mild traumatic brain injury. In collaboration with Rao Gullapalli and Jiachen Zhuo at the University of Maryland School of Medicine, the team is using new methods for big data analysis and visualization, combined with advanced imaging techniques, to map subtle changes in gray- and white-matter brain fibers not visible in typical MRI scans. Photo: John T. Consoli.")
A computer scientist and his team of students at the University of Maryland analyze hundreds of thousands of gene sequences as part of the largest, most comprehensive study of childhood diarrheal diseases ever conducted in developing countries.
The study, which is a collaboration with the University of Maryland School of Medicine’s Center for Vaccine Development, includes 22,000 children in regions of Asia and Africa. The researchers hope to detect a pattern that holds clues to lifesaving medical treatments for diarrhea, the second-leading killer of children worldwide.
“The beauty of big data is that it could help us identify new bacteria or existing bacteria that we never suspected were associated with diarrheal disease,” says Mihai Pop, associate professor of computer science with an appointment in UMD’s Center for Bioinformatics and Computational Biology. “As you continue to work with the data and patterns emerge, one set of findings can lead to another, such as the discovery of completely new pathogens.”
Pop is just one of many researchers in the College of Computer, Mathematical, and Natural Sciences (CMNS) who is harnessing the power of “big data”—a popular term used to describe the massive amount of information that is acquired, stored, searched, shared, analyzed and visualized—in the quest for answers to some of the world’s most complex problems. Using the latest computational tools to extract the most important pieces of information from these huge data sets and applying sophisticated analytic techniques, researchers are discovering patterns and making unexpected connections in virtually every scientific discipline.
Pop’s work is one example of how big data is turning research on its head—revealing patterns before hypotheses are made. “In the past, researchers had a theory or hypothesis and suspected certain patterns or trends. We used data to confirm those hypotheses. Today, we may not know exactly what we are looking for, but we can use data to make new discoveries as theories and patterns emerge,” says Joseph JaJa, professor of electrical and computer engineering with an appointment in the University of Maryland Institute for Advanced Computer Studies (UMIACS). JaJa also serves as director of cyberinfrastructure for the National Socio-Environmental Synthesis Center (SESYNC), which is funded through a National Science Foundation (NSF) grant to UMD.
Just as the invention of the microscope opened new worlds, big data is unveiling the next frontiers for scientific discoveries. “Drawing from multiple sources of information, data can be fused to provide a big picture through the ‘macroscope,’ and researchers can zoom in on different levels of detail,” says Amitabh Varshney, UMIACS director and computer science professor.
Within and across their areas of expertise, CMNS researchers are making order out of big data chaos as their research pinpoints meaningful patterns that could move them closer to the next big breakthrough.
The Potential to Improve Lives
The potential of big data to improve and save lives is most evident in health care and the biological sciences. The amount of health-related data is expanding exponentially, and the latest data collection and analysis techniques are allowing researchers to make unanticipated connections that could translate into new ways to treat and cure disease.
Varshney is developing visualization techniques to illustrate stem cell division, in collaboration with Antonio Cardone, UMIACS assistant research scientist; Peter Bajcsy, National Institute of Standards and Technology (NIST) computer scientist; and Carl Simon, NIST biologist. “Visualization can turn complex sets of data that are too big, too small or too scattered into infographics or diagrams that often reveal unexpected patterns and connections,” Varshney explains.
The NIST researchers are documenting the entire stem cell division process, with each imaging experiment generating some 700 gigapixels of data. Varshney is creating software to display the images and differentiate by color the various textures of different parts of the cell, a process called texture-driven recolorization. “The visualization tool allows researchers to characterize individual cell properties and interactions with other stem cells,” says Varshney. If conditions and patterns that promote cell growth can be identified, those conditions could be replicated in the laboratory to create new cells. “Those new cells could ultimately replace dying cells to restore tissue or organ function. That is a key goal of regenerative medicine,” adds Varshney.
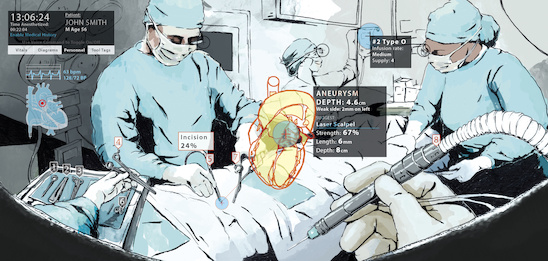 If Varshney has his way, physicians could one day make treatment decisions in an augmented reality setting surrounded by wall-size images of MRIs, X-rays and o ther medical data. Varshney, who began his career designing three-dimensional simulations for military applications, plans to create an augmentarium, a virtual-reality research environment that combines high-performance computing with advanced visualization techniques. The augmentarium is the latest technology enhancement proposed for UMIACS, which currently houses an 11-foot by 7-foot display wall consisting of 25 separate tiles that can project images with 25 times more detail than the average photograph.
Mihai Pop is using big data to accelerate discovery in the field of metagenomics—a discipline that involves studying the genetic material of microorganisms. His recent research focuses on the thousands of microbial communities that live in our bodies. As part of the National Institutes of Health-funded Human Microbiome Project—a study of some 10,000 species of microbes that collectively have more than 8 million genes—a lack of patterns caught researchers’ attention. “We were surprised we could not identify a core human microbiome that was universal in all patients,” relates Pop. “Big data has revealed the tremendous diversity among people, which confounds any simplistic approaches aimed at understanding the differences between healthy and sick people.” This finding is changing how studies are organized, with a focus on tracking individuals across time to eliminate some of the variability in observations and make it easier to uncover new insights, according to Pop.
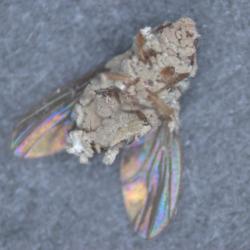
When it comes to exploring complex biological questions, sometimes the smallest scientific systems can hold important clues. “Insects are great model hosts for understanding the evolution of pathogens and pathogenesis,” says Distinguished University Professor of Entomology Raymond St. Leger, who is sequencing 13 different genomes—each providing 30 million base pairs—of Metarhizium, tiny fungi that can penetrate directly into insects. St. Leger is studying the genomic structure of these fungi to identify genetic differences and how novel pathogens emerge. “The more genomes you include, the more geometrically difficult it is to analyze and compare as you mix and match,” explains St. Leger. His laboratory is also interested in re-engineering these fungi to produce antimalarial proteins that could be transferred to a mosquito, thereby restricting its ability to carry and spread malaria. “We need lots of comparative data to find specific patterns in gene expression and determine when and where we can tweak the pathogens so they permanently suppress the malaria-carrying mosquito.”
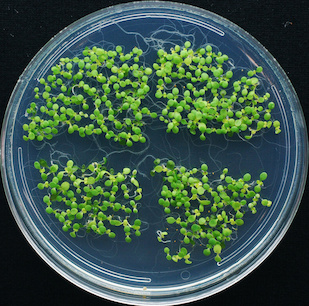 In her work on plant signaling, Caren Chang, professor of cell biology and molecular genetics, has turned to another small system that has generated large amounts of data and been cited in thousands of research papers worldwide: the plant model Arabidopsis thaliana, the first complete plant genome to be sequenced. “I am trying to understand the hundreds of genes and proteins that signal ethylene, the fruit-ripening hormone that also plays a role in many aspects of plant growth and development, including protection of plants from environmental stresses, such as drought and insect attack,” says Chang.
To advance her work and leverage prior research, she is collaborating with Louiqa Raschid, professor in the Smith School of Business with appointments in UMIACS and computer science, who applied a data retrieval tool she developed with collaborators at the University of Iowa to thousands of published works on Arabidopsis to extract gene-related sentences and terms. The team experienced an “aha” moment when Raschid called Chang to verify patterns about certain genes. “Caren was surprised at my level of knowledge. I was simply looking at the patterns in the data that made it easy to review the literature without the genetic expertise,” says Raschid. Because Arabidopsis contains numerous genes implicated in human diseases—such as cancer and Alzheimer’s disease—understanding its genes offers clues to other living organisms.
Across all disciplines, big data techniques can help researchers quickly review reams of published research in their fields and determine how their work adds to accepted knowledge. Computer Science Associate Professor Hal Daumé III is developing advanced data analysis tools to process the written word and make basic search decisions on language quickly, using higher-level linguistic analysis only when needed—a technique called learned dynamic prioritization. The tools can be used to identify future trends in science and technology, by coupling the way scientists discuss ideas with analyses of patterns in standard sources, such as academic citations.
Daumé adds, “We are developing models that can dynamically decide how much information a user needs and when to look further. Our technique is as accurate as previous approaches but up to 10 times faster because less time is spent on the more obvious analyses, freeing up time for the difficult cases.”
Big Data Changes the Panorama of Land, Sea and Sky
 Exciting new facilities and greater access to national and international experimental data sets are providing researchers in the physical and environmental sciences more resources to inform their work.
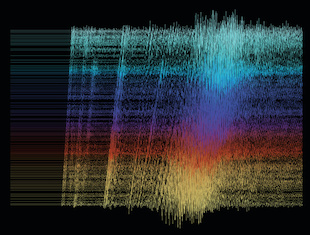
NSF’s largest investment in studying the solid-earth sciences has already yielded some 65 terabytes of data—or more than 26 billion single-spaced typewritten pages of information—and adds another terabyte, on average, every six weeks. The EarthScope Facility network of 1,600 seismometers is generating voluminous amounts of data as it measures ground vibrations from stations in all 48 contiguous states, Alaska and Puerto Rico, covering 3.8 million square miles.
“There is not a seismologist in the world who has not used this data,” says Geology Assistant Professor Ved Lekic. “It has revolutionized our ability to detect and image structures in the earth’s interior and has increased data availability a hundred-fold.” Lekic and his students are using recordings of ground vibrations to detect the scattering of seismic waves across the base of the North American tectonic plate. They also develop methods to more accurately and cost-effectively analyze those recordings to determine the shapes of seismic waves as they pass through structures below the earth’s surface.
Lekic’s research is funded in part by a recent NSF Early Career Faculty Development Program award, which will also support an undergraduate geology program. “We want to give students experience with data collection and analysis so they can take full advantage of the wealth of massive data sets gathered around the world,” notes Lekic.
Data drawn from satellite observations are the basis for much of Atmospheric and Oceanic Science Professor Rachel Pinker’s work on radiative fluxes, the electromagnetic radiation received from the sun or emitted from the atmosphere and/or the earth’s surface. Pinker’s work explores the variability in these fluxes, which could dramatically affect the climate system and the water cycle.
In collaboration with a team of hydrologists at Princeton University and the University of Washington, Pinker is using her expertise to help build Earth System Data Records for the global terrestrial water cycle, a task that requires storing and analyzing information from all available geostationary and polar-orbiting satellites from the early 1980s to the present, representing some 100 terabytes of information. In another joint effort, this one with U.S. and French scientists, Pinker is using extensive satellite data to study radiative fluxes and turbulent (sea-air) fluxes over the oceans, focusing on the impact of aerosols. “This information can improve estimates of the amount of heat stored in the oceans and can add to the body of knowledge on weather patterns, including hurricanes and droughts,” says Pinker.
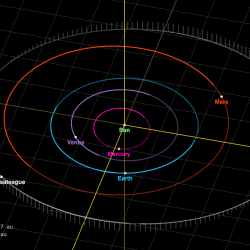
 Astronomy Professor Lee Mundy is eager to tap into a new source of big data based in Chile. In a project funded by the National Radio Astronomy Observatory and the NSF, Mundy will have access to a flood of data from the new Atacama Large Millimeter/submillimeter Array (ALMA). “The primary output will be large data cubes—images with thousands or tens of thousands of planes of information about the structure, movement and chemical composition of the material that contributes to the formation and evolution of galaxies, stars and planetary systems,” says Mundy. “In the old days, we would get a few cubes with a few hundred planes that we could examine by eye. It is just impossible for the human brain to process the terabytes of information coming from ALMA.”
Mundy is working with Amitabh Varshney to apply computer science techniques to this astronomy data. “For instance, using an established computing technique, researchers can analyze the data cubes according to a specific set of criteria, then focus on the most important features. Next, the computer can be directed to find these features in a large set of data cubes, display the results and further refine the features selected,” explains Mundy.
Back on the ground, SESYNC postdoctoral fellow Mary Collins is using big data sets to determine whether the country’s major industrial polluters are contributing to pollution disproportionately in poor and minority communities. In a cross-disciplinary collaboration, Collins is working with Joseph JaJa and Ian Muñoz, scientific programmer at SESYNC, to cross-reference many years of data from the Environmental Protection Agency’s Toxic Release Inventory with U.S. Census Bureau data. The team is examining the inventory’s records of nearly one billion chemical releases from industrial facilities across the continental U.S. and data on population characteristics—primarily race, income and education—from some 8 million U.S. census blocks.
“Computer science techniques from machine learning, statistics and visualization enable researchers to explore many ideas at once and interact with large-scale, spatio-temporal data—over a period of time in various locations—while testing different hypotheses,” reports JaJa. The next step: substantially enlarge the current study and analyze up to 30 years of data to gain deeper insight into the relationship between toxic releases from industrial plants and demographics.
Mining Social Networks and User-generated Data
With the proliferation of social media, individuals are now generating an unprecedented volume of personal data. Today, more than 1 billion people use Facebook each month, individuals share more than 400 million photos each day on Snapchat and 1 billion “likes” are posted on Instagram daily, making social networks fertile ground for analyzing user behavior patterns and constructing new operational tools.
Computer Science and UMIACS Professor Ben Shneiderman recently took part in a first-of-its-kind study that analyzed patterns in tens of thousands of Twitter conversations to provide a topographical “map” of Twitter users, visually identifying six distinct structures in discussions. Sponsored by the Pew Research Center, the study relied heavily on open-source software called NodeXL, which was tested extensively by Shneiderman and many of his graduate students in the UMD Human-Computer Interaction Lab. The software helps translate large data sets into networked visualizations of tweets, retweets and the social networks of Twitter users. “Visualization helps identify patterns and makes data clear, actionable and understandable,” says Shneiderman.
Jimmy Lin, associate professor in the iSchool, computer science and UMIACS, spent an extended sabbatical at Twitter from 2010 to 2012, where he worked on services designed to identify relevant content for users and on analysis tools to support data science. His research at Twitter contributed to the “Who to Follow” service, which automatically suggests accounts to follow, and to expert search, a product to help users find accounts that match their interests.
Lin has long been interested in building tools to support data mining and analysis at a massive scale. “Today, companies ranging from Twitter to Walmart to Bank of America gather vast amounts of data about their customers, which they analyze to learn more about customers and improve their business,” says Lin. “This is what data science is all about—extracting insights from data to better inform decisions.” Lin is now focused on building algorithms and distributed systems to analyze such data in real time.
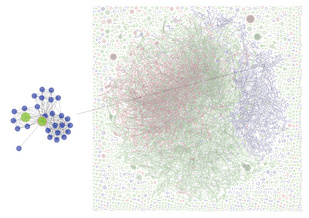 According to Amol Deshpande, associate professor of computer science and UMIACS, data from all types of networks—from social to communication to financial transaction—are most naturally represented as graphs of entities and the connections between them. For this reason, Deshpande has set his sights on creating a general-purpose, graph data management system that enables users to store, process and analyze very large volumes of data in an easy-to-use intuitive manner, which no data management system can do today.
He is designing tools to help users extract insights and knowledge from large-scale network data, such as determining if multiple names in a network belong to the same entity (entity resolution) or identifying the most important entities in a network (centrality analysis). “In a social network, centrality analysis could mean identifying an influential person based on how many other influential people he or she is connected with,” explains Deshpande. He is also interested in creating ways to handle streaming and continuously evolving dynamic data. “There are millions of tweets hourly,” says Deshpande. “We want to develop a streaming system that continuously updates new events and analyzes them immediately.”
As the volume of multimedia data explodes across all platforms, including social networks, Computer Science Department Chair Samir Khuller is focusing on the storage and movement of data over local-area and wide-area networks. Long before Netflix was streaming video to millions of users worldwide, Khuller was grappling with the need to meet rapidly changing multimedia demand: How do you predict popularity and shifting demand? How many copies of each data item must be stored? How can servers be designed to accommodate changing access requirements? “Systems must be capable of dynamic reorganization, which requires a more robust mapping of data items and greater versatility in data layout,” says Khuller, who estimates that more than 90 percent of Internet traffic today involves multimedia.
He is creating algorithmic techniques that can improve the performance of large multimedia data storage systems. “We want to build systems that can cope more gracefully under unreasonable demand situations,” explains Khuller, whose primary collaborator is Leana Golubchik, former computer science associate professor at UMD now at the University of Southern California.
Across every network and every computing platform, from mobile to cloud technologies, data protection remains a critical concern. “The biggest challenges for security and privacy are distributed networks, the scale of systems and the massive amounts of data,” says Computer Science Assistant Professor Elaine Shi. “When many operating systems, such as those in mobile phones, were developed, few imagined how the systems would be used to collect data of every kind. Usage has gone beyond the capacities of many current models.” This contributes to what Shi calls privacy diffusion—the scattering of personal and sensitive information within and across systems.
The accelerated growth of the cloud computing market brings even more security challenges. Shi was recently awarded a Sloan Fellowship for her work in securing data in the cloud against physical attacks. “Our goal is to build a cloud platform that can automatically protect user data, whether from a malicious insider at a large company or an intruder,” Shi explains. Her team has created a secure processor that prohibits an attacker from accessing any sensitive information stored on the system by probing memory or system buses, the high-speed communication channels used to transfer information between components.
The Ultimate Challenge
The big data revolution is here, blurring the lines between the traditional disciplines of computer science, mathematics, the physical sciences and the life sciences. As the revolution unfolds, the ultimate challenge remains finding those unexpected connections and teasing out the related patterns in data. “We are just beginning to get a full glimpse of what lies ahead in this promised land,” says Amitabh Varshney.
No matter the size of the data set, the information ultimately must have value and add knowledge—whether improving health, predicting global climate change or advancing the understanding of social behavior. Louiqa Raschid, whose work on database and data management projects spans health care, financial and social media applications, explains, “Big data, in and of itself, is not really of any value at all. In the end, discovery comes from finding the small nugget of information that is most important to the user.”
Writer: Nancy Grund